Do you want to know what factors Rategenie considered when generating a nightly price for your rental? With the Rate Breakdown feature, you can easily see any market or occupancy data that was used by Rategenie when generating your rental rates.
Click on a date
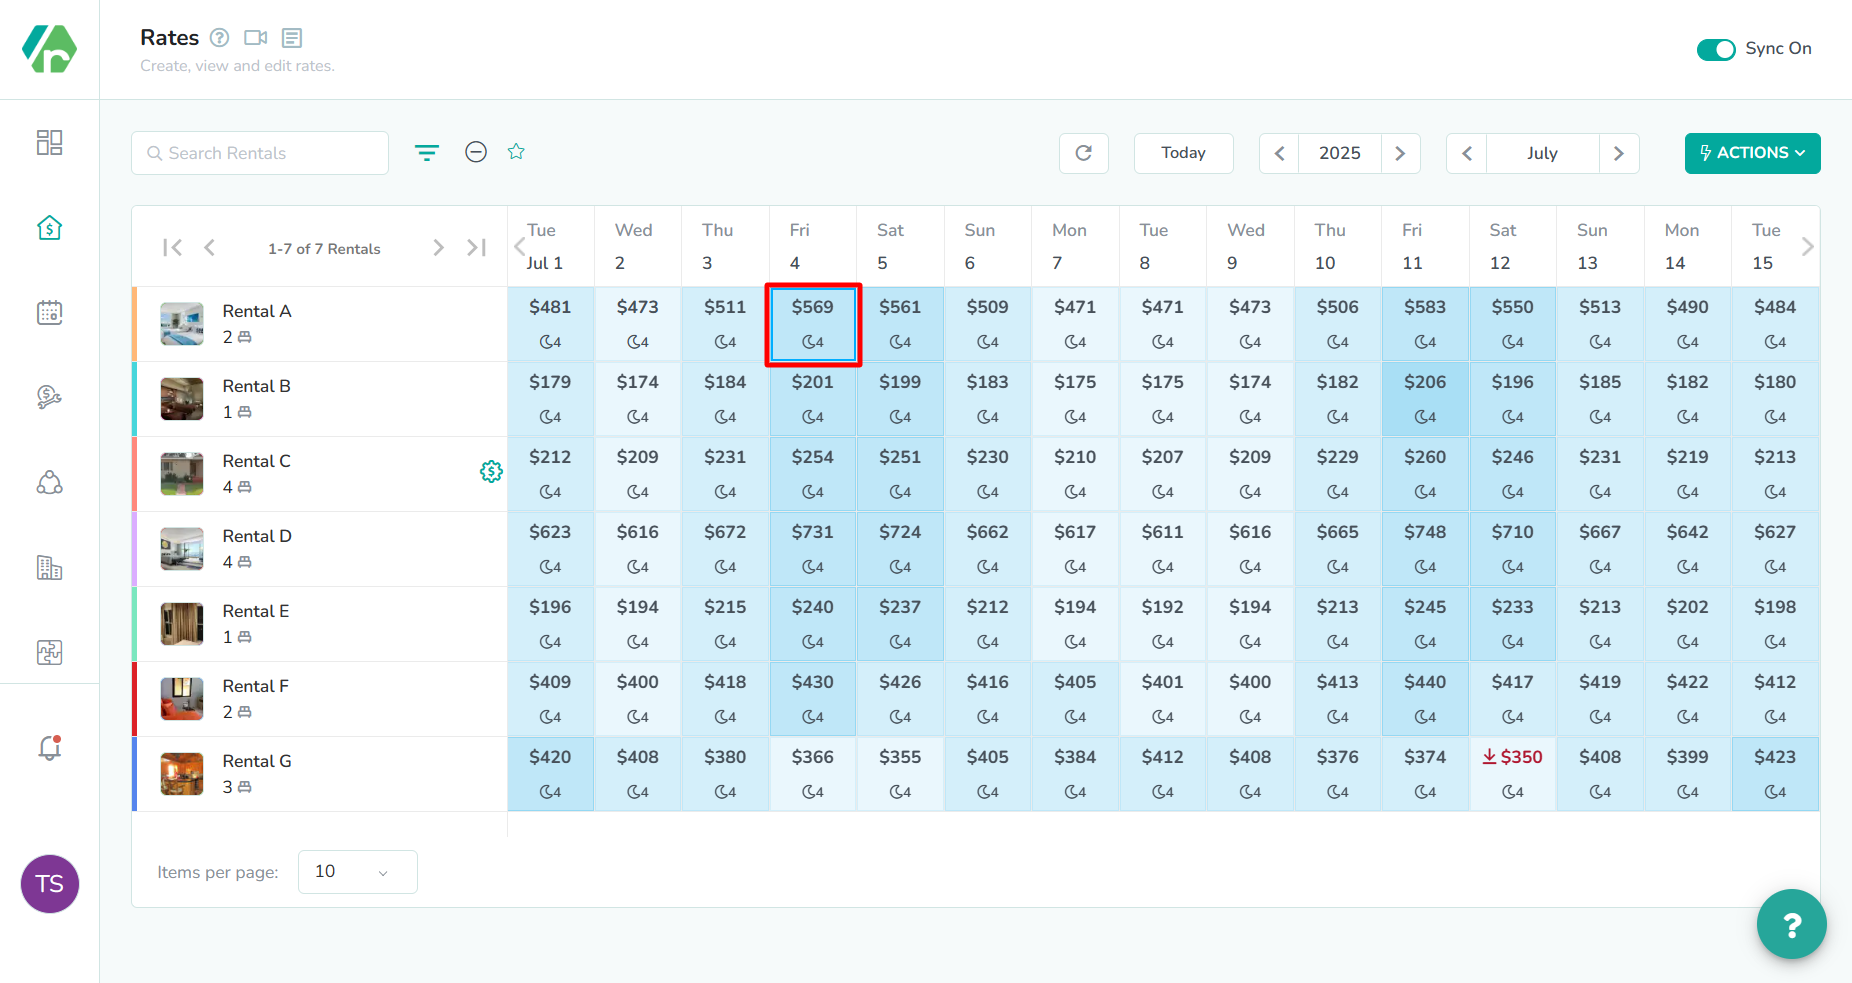
The break down for each nightly rate can be access directly from the calendar. Click on a date tile in the calendar, to open the Rate Breakdown modal.
Review the breakdown details

The breakdown details contain four different categories that are pulled from both the market data and the assigned rate strategy: Starting Rate, Adjustments, Month Variance, and Final Rate.
Analyze the starting rate

First, the starting rate field represents the price that will be used before applying any adjustments. This number may be the base rate, or it might differ from the base rate, based on the market conditions for the specified date. If you are unsure of how to set the base rate for your rentals, you can learn more about the Market Base Rate Recommendation feature.
In our example, we see a starting rate of $568.Analyze the adjustments
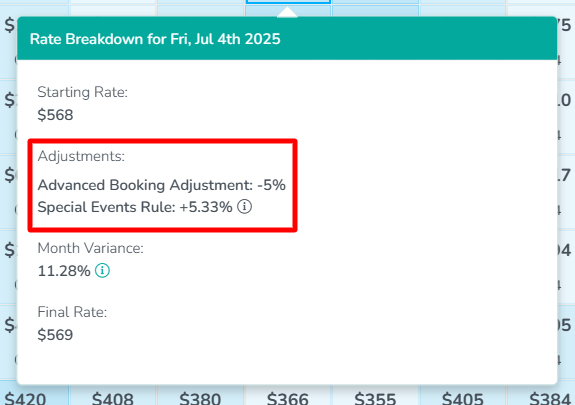
Next, the primary adjustments that are made to the starting rate are based on the rules that have been saved to the strategy. If there are multiple adjustments to be made for a specific date, then they will all be listed here, along with the percentage or flat fee adjustment that was made.
In our example, we see that there are two strategy rules active for July 4th. The advanced booking adjustment and special events rule are both active on the date. As a result, their adjustments are added together. One rule is decreasing the price, and one rule is increasing the price. When combined, they result in a slight increase to the starting rate.Analyze the month variance

Next, the month variance field is the percentage difference between the rate for the specified night, and the average nightly rate for the month. This may be either a positive value, or a negative value. A positive value means that the nightly rate displayed is higher than the monthly average nightly rate for the specified month. A negative value means that the nightly rate displayed lower than the monthly average nightly rate for the specified month. If you find that this number is consistently large, then you might want to consider changing the assigned price percentile either up or down, in order to more closely match the rest of the market segment.
In our example, we that the month variance for the rate is 11.28%. This means that the nightly rate is 11.28% higher than the average nightly rate for other rentals in the area that month.Analyze the final rate
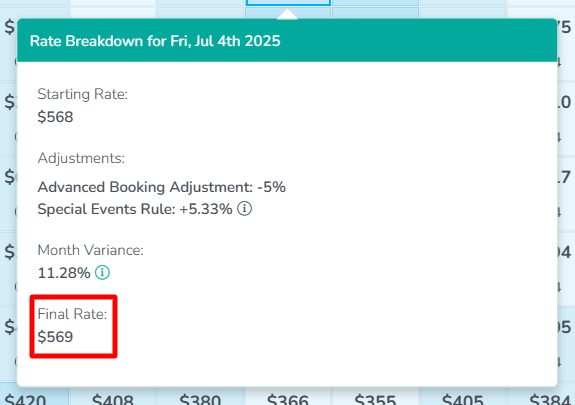
Lastly, the final rate is generated once all of the adjustments have been applied to the starting rate. This is the final rate that will be pushed to any connected channels.
In our example, we see that the final rate is $569. This is a result of the two adjustments nearly cancelling each other out, which results in an increase of 0.33% to the starting rate.