All Categories
>
Rates
>
Market Data: How to choose a price percentile for specific rentals
Market Data: How to choose a price percentile for specific rentals
Updated
by
Tokeet Support
Do you want to configure your rental so that it follows the price movement of other similarly-prices rentals in the same area? With the Market Data feature, Rategenie will help you to find the right price percentile, so that your rates precisely match the quality of your rental.
Let's take a look at an example where we use market data to first identify the price percentile that our rental belongs to, and then use that price percentile to set our min, max, and base rates. We will be using one of our more average rentals for this example.
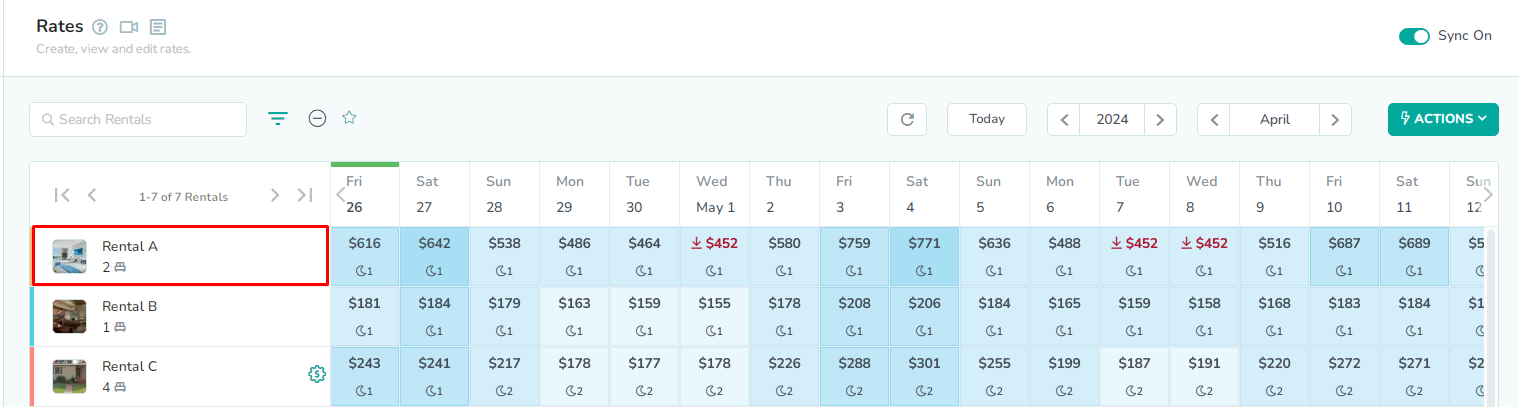
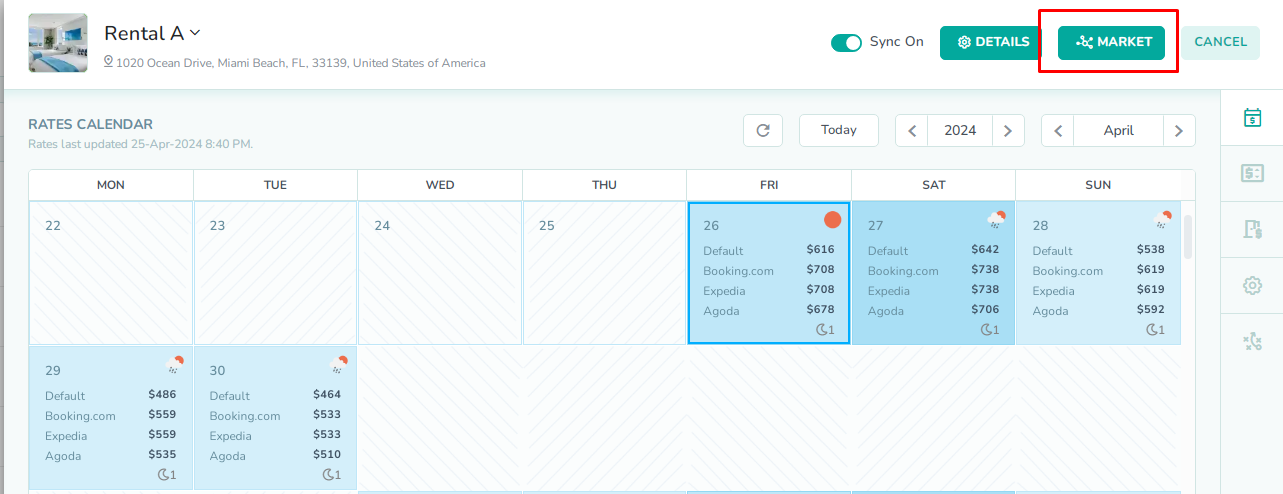
Click the rental name
The Rental is located in the left-most column of the rates calendar. Click here to open the rental rates overlay.
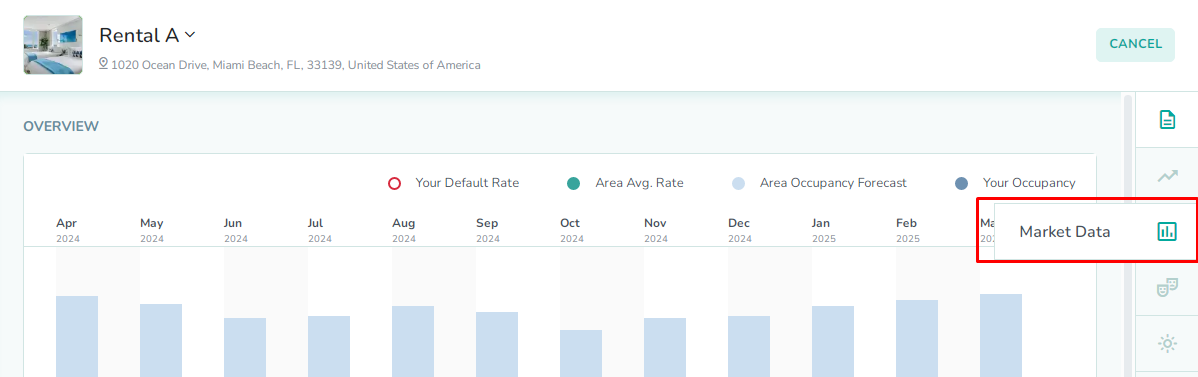
Click the Market button
The Market button is the second button at the top of the rental rates overlay. Click here to open the rental market overlay.
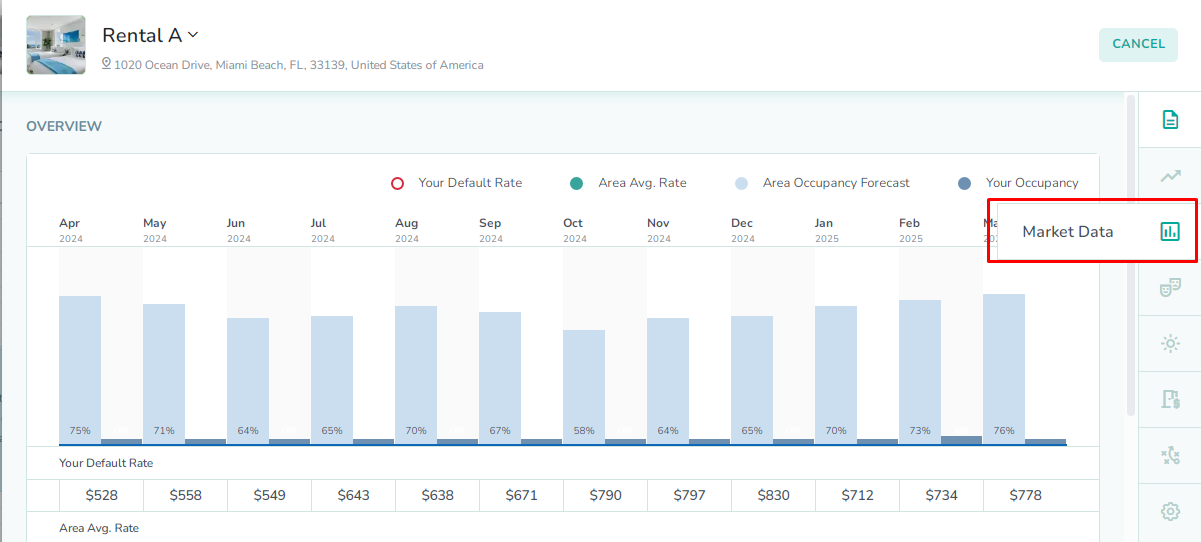
Click the Market Data tab
The Market Data tab is the third tab in the right sidebar of the rental market overlay. Click here to open the Market Data tab.
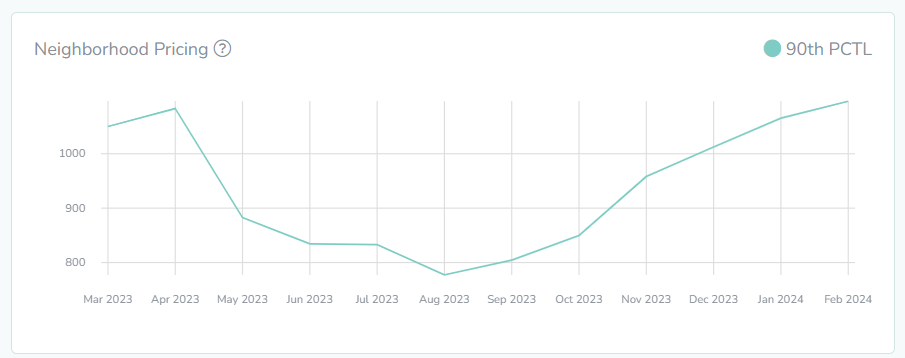
Review the Neighborhood Pricing chart
The market data tab contains a number of charts displaying different performance metrics for the area where your rental is located. First, scroll down to the Neighborhood Pricing chart, in order to view the average nightly pricing per month for the area.
If you have not selected a price percentile on the rental rate settings overlay, then this chart will show the average nightly pricing for all available price percentiles. If you have already selected a price percentile on the rental rate settings overlay, then this chart will only show the average nightly pricing for that specified price percentile.
In our example, we can see all available price percentiles displayed in the chart. This is because we have not selected a price percentile for the rental. We will use this chart to help us pick the ideal price percentile for our rental.
Select the price percentile
Lastly, you can use the neighborhood pricing chart to select a price percentile either based on which segment of the market you believe the rental belongs to, or based on the nightly price range that you want to charge for the rental. Rentals in the economy market segment will generally occupy the 25 percentile. These will be the most affordably-priced rentals in the area. Rentals in the average market segment will fall into the 50 percentile. These are usually middle-of-the-road rentals which are neither at the bottom nor the top of the nightly pricing list for the area/ Rentals in the midscale market segment will belong to the 75 percentile. These will be among the nicer rentals in the area, but not the most luxurious units in the area. Rentals in the upscale market segment will follow pricing for the 90 percentile. These will be the most-expensive rentals in the area, but also the least-common.
The 90th percentile represents the most expensive properties in the area, but that means it also contains the fewest rentals of all of the price percentiles. As a result, rentals assigned to the 90th percentile are more likely to be influenced by outlier pricing behavior from other rentals in the same area.
In our example, we can see that the pricing for the 50th percentile best-matches our desired price movement. The average nightly price goes from a low of $294 in September (low season), up to a high of $440 in March (high season). This is the price range where our rental has seen the most success in recent year, and it also matches our rental, which about average for the area. You can apply your own criteria when selecting a price percentile.
How to use the neighborhood pricing
Open the rental rate settings
Next, open the rental rate settings. The price percentile can be entered into either the rental rate settings, or into the settings for the rate strategy assigned to the rental. The only difference is that applying the price percentile at the strategy level allows the price movement to be applied to multiple rentals at once.
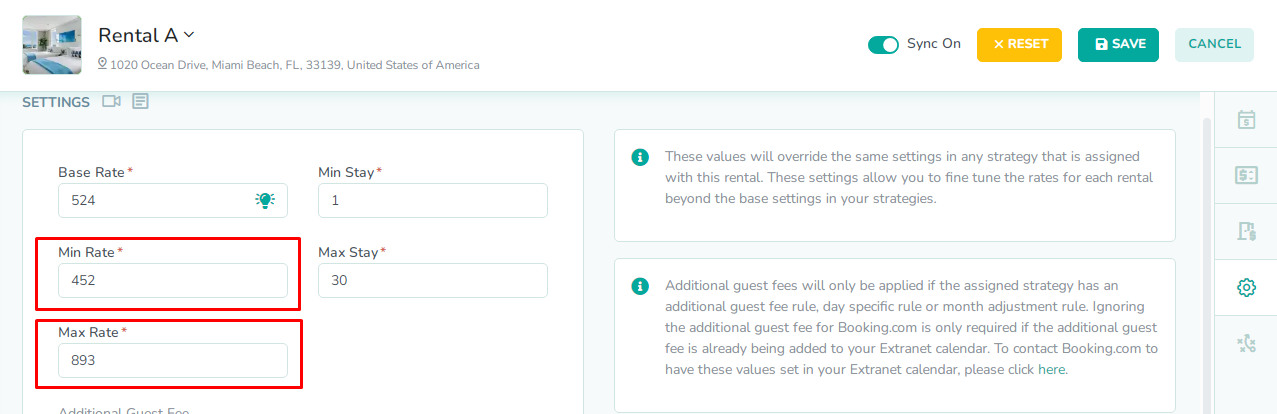
Enter the neighborhood pricing
Next, you will apply the information learned from analyzing the market data for the rental. The Neighborhood Pricing chart allows you to see the average nightly price for each month. This also allows you to see the minimum and maximum average nightly rates for the year. These numbers can be used to set your min and max rates for the rental.
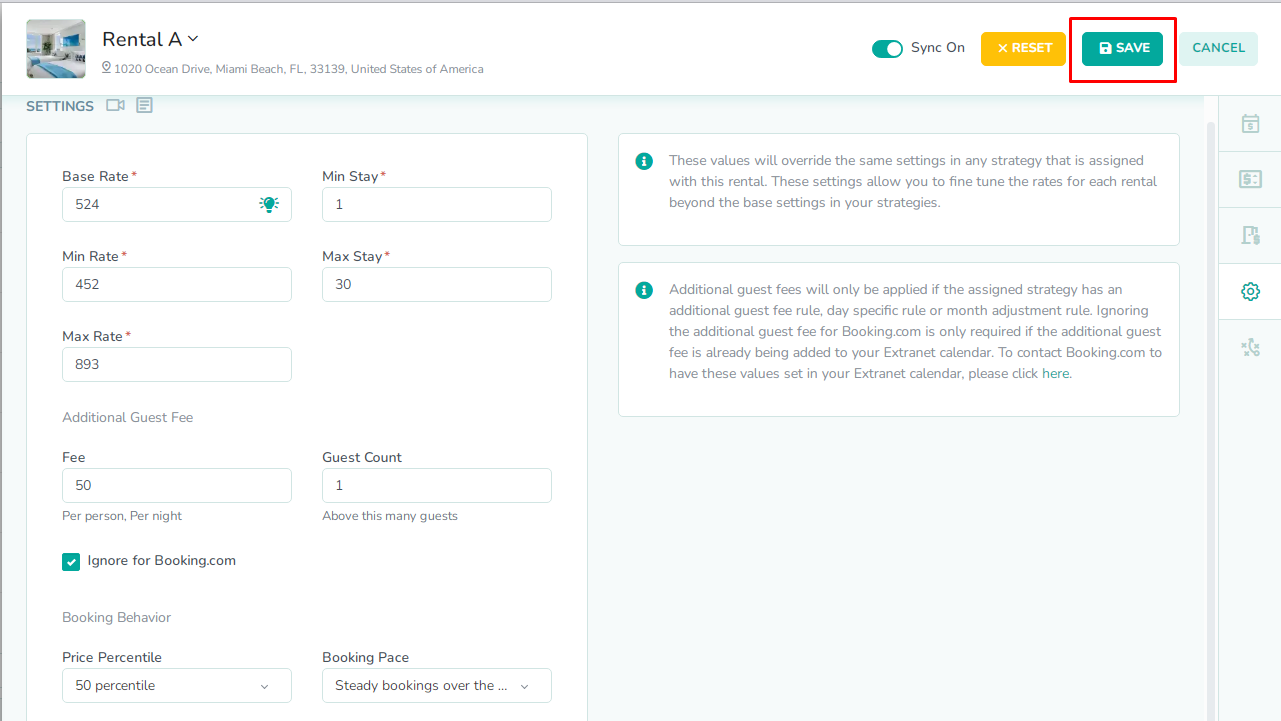
In our example, we see that the average nightly price goes from a low of $425 in September (low season), up to a high of $529 in March (high season). As a result, we have set our min rate at $440, and our max rate at $600. This will allow the rates generated to stay on the high side of the market segment. You can apply your own criteria when setting your min and max rates.
Enter the price percentile
Next, select the Price Percentile that you have chosen from the rental market data. This will allow the price movement of the generated rates to match the min and max price range that has just been set.
In our example, we have selected the 50th percentile, which is the price percentile that matches the price range that we have set for the rental.
Click the Save button
Lastly, click the Save button to save the rental rate settings. New rates will now be generated for this specific rental, using the settings on this tab together with the rest of the rules in the assigned rate strategy.
How to access market data from the rentals page
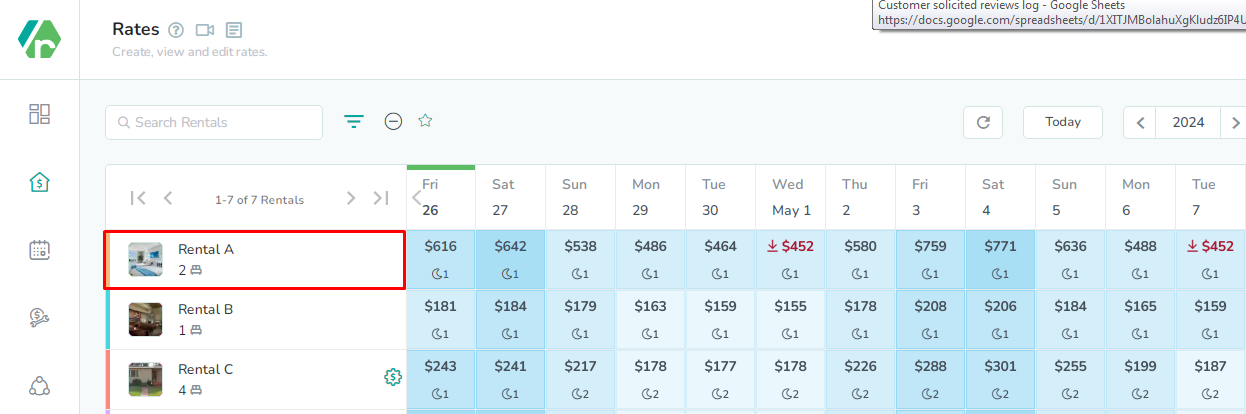
Click the rental name
The Rental is located in the left-most column of the rates calendar. Click here to open the rental market overlay.
Click the Market Data tab
The Market Data tab is the third tab in the right sidebar of the rental market overlay. Click here to open the Market Data tab.
Analyze and apply the market data
Now you will analyze and apply the market data visible in the overlay by repeating Step 4 through Step 9 from earlier in this guide.
As always, please contact us with questions any time. We're happy to help.

 If you have not selected a price percentile on the rental rate settings overlay, then this chart will show the average nightly pricing for all available price percentiles. If you have already selected a price percentile on the rental rate settings overlay, then this chart will only show the average nightly pricing for that specified price percentile.In our example, we can see all available price percentiles displayed in the chart. This is because we have not selected a price percentile for the rental. We will use this chart to help us pick the ideal price percentile for our rental.
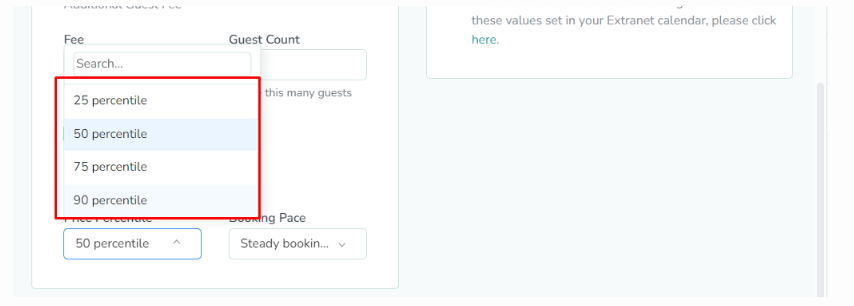 The 90th percentile represents the most expensive properties in the area, but that means it also contains the fewest rentals of all of the price percentiles. As a result, rentals assigned to the 90th percentile are more likely to be influenced by outlier pricing behavior from other rentals in the same area.In our example, we can see that the pricing for the 50th percentile best-matches our desired price movement. The average nightly price goes from a low of $294 in September (low season), up to a high of $440 in March (high season). This is the price range where our rental has seen the most success in recent year, and it also matches our rental, which about average for the area. You can apply your own criteria when selecting a price percentile.
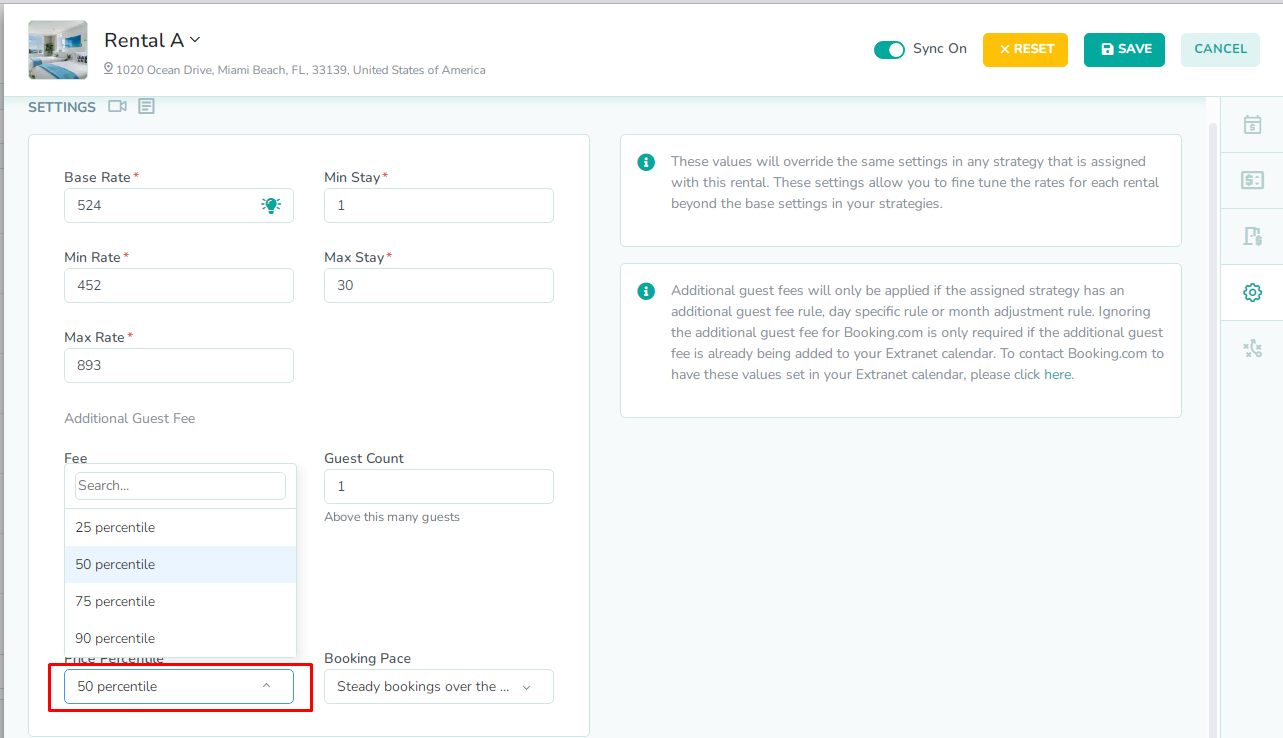
 In our example, we see that the average nightly price goes from a low of $425 in September (low season), up to a high of $529 in March (high season). As a result, we have set our min rate at $440, and our max rate at $600. This will allow the rates generated to stay on the high side of the market segment. You can apply your own criteria when setting your min and max rates.
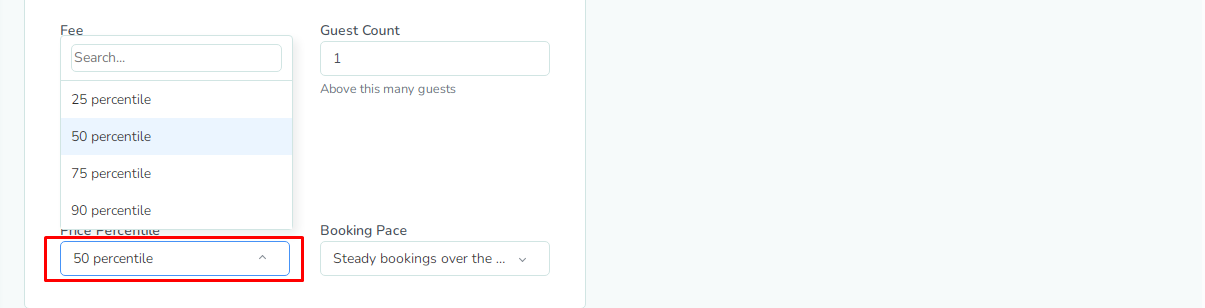 In our example, we have selected the 50th percentile, which is the price percentile that matches the price range that we have set for the rental.